Our Data Scientists Changed The Way Our Client Does Business For Good

Purpose
Our client is in a healthcare business running a couple of beauty and wellness clinics on the Mexico side of the US-Mexico border. They have a lot of unstructured data collected across Google Analytics, Google Adwords, CTM, InfusionSoft, and Mindbody. Since the source of data is through different channels, it was proving difficult to first merge it all together and then to get the insights that can actually help them to grow the business. Here is where fullfunnelservices comes in. We took this project under our wings, we started with cleaning of data, merging the data from different sources via common data points, and then we ran stimulations to get insights, few of those have brought up some hidden trends which have surprised our client.
*We will only be sharing a year of data and our stimulation on it for confidential purposes. For data security purposes, the visual plots only display the relative value rather than absolute value.
Dataset
The core reason behind this project is to find patterns among the sales which allows them to know the right service and right platform to target the right audience for their services. We have found the best services and locations for their business and not only that the combination of different services and locations tells another story altogether.
The main study that we have done revolves around CTM, InfusionSoft, and Mindbody but there is a significant contribution from Google Adwords and Google Analytics.
Google Analytics
Google Adwords
InfusionSoft
Mindbody
Insights
CTM – Call tracking metric

Total number of calls or Call Volume is a key metric for tracking the performance of SEO and PPC strategies.
- First, the red moving trend is the 7-day rolling average of Call Volume, which is a method to remove the day-of-the-week effect. In this way, it is clear that Call Volume has a flat trend over 2019.
- Second, Anomaly Detection can help the client easily figure out values out of expectation. Seasonality is considered as one of the factors. Other factors can be SEO, PPC, or any lead generation strategies, such as updating content on social media, responding to all comments and reviews. For example in 2019-07-04, we only had 25 Calls which was below the minimum. Because 2019-07-04 is independence day, this anomaly point is reasonable.
Tracking sources in CTM are categorized into Pre-programmed and Customized tracking source.
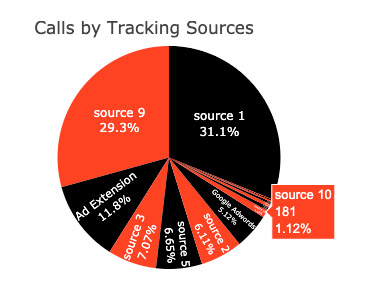
- The following pie chart gives an overview of tracking sources gain the majority of calls. This can help the client better understand ROI and performance of various lead sources.
- Notice that 60.4% of the came from source 1 and source 9. Since these two sources are tracked to drive the most calls, next we will break down by medium and source to figure out which medium/sources make them stand out.
Medium – Source
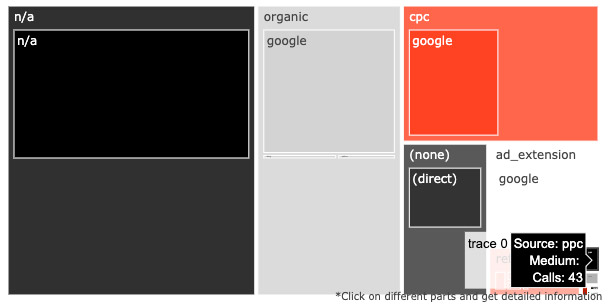
- Since there are too many sources for referral, here we only show the source/medium cover 99% calls. Although referral has the most number of source types, it did not drive as many leads as what we expect.
- Google is the major source for mediums like organic, CPC, ad_extension.
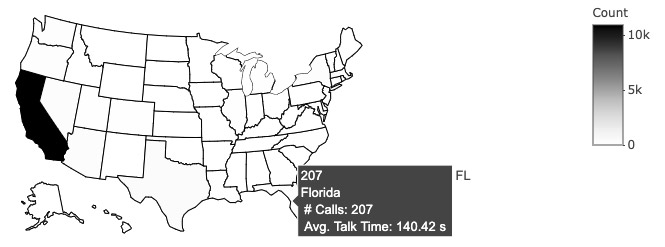
Geographic can also be used to identify the most profitable area of marketing.
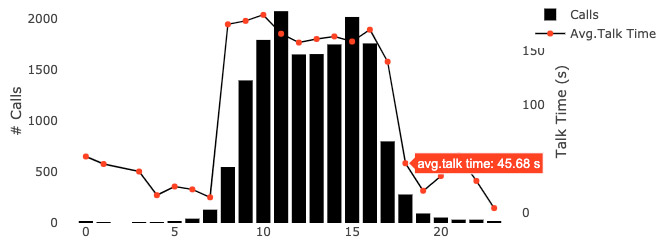
- Not all calls have equal value. The longer the talk lasts, the more chances they have to convert into a customer.
- Time of calls helps clients understand what time of day drives the largest percentage of calls volume. Since this time period: 9-16, has majority calls, we would suggest this client increase ad budget at this time. Attracting customers attention for low calls hours by updating contents on social medium, email marketing are good choices as well.
Mindbody
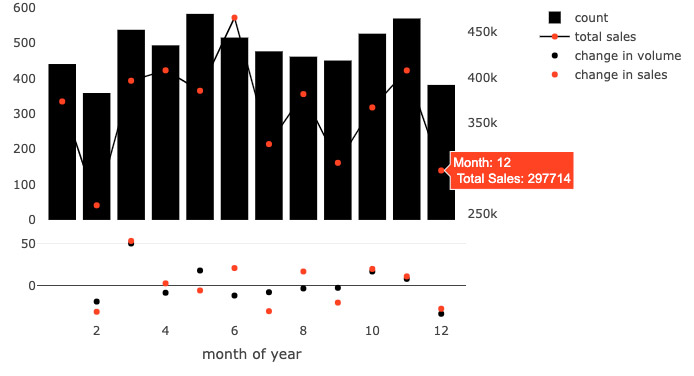
- Monthly sales volume (sale_id as a unit) and total sales with change compared to previous month.
- In this plot, the client can get an overview of the monthly business performance over 2019. For example, total sales has increased by 20.9% in June, while sales volume has a decrease by 11.49%. Next, we will want to figure out why these changes happened.
Mindbody & InfusionSoft Combination
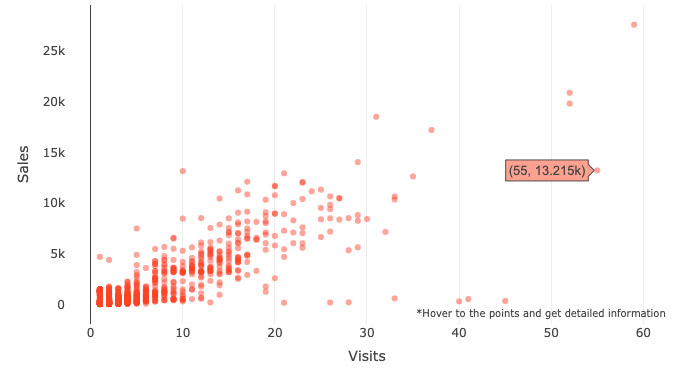
Total visit vs. Total Sales -> scatter points
- Majority of the converted customers visited the website less than 20 times. The more times they visit, the more they would spend.
One of the most important KPI is Users.
By tracking the performance of this metric, we get time-series data.

- It’s clear that there is a day-of-the-week effect. To remove this effect, use a 7-day rolling average. Then we can explicitly see the moving trend of Users.
- Anomaly Detection is a commonly used method in time-series analysis. Orange points in this plot are identified as anomaly points by using Anomaly Detection (STL + IQR methods for the situation that seasonality is not a major factor). Grey area covers 95% of all data points. Points out of this area are identified as anomalies.
- For each anomaly point, we will break Users down to several segments to figure out which specific part has caused this positive/negative change. This can help with decision making in the next step. For example, in 2019-12-31, we had 132 Users which was the minimum. After comparing it to YOY data it is clear that the last week of December is when the client receives least users and hence it make sense to lower down the budget at that time.
Geographic data
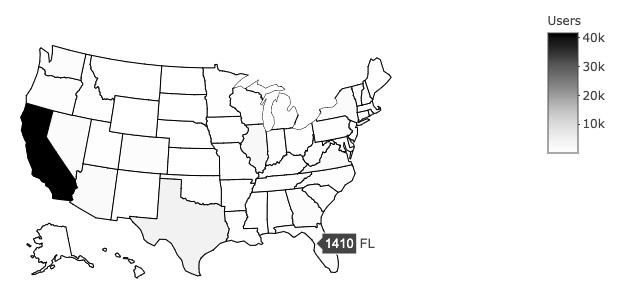
It can also be used to identify the most profitable area of marketing. From the data, it is clear that users mainly came from CA (84.4%) for this time period. This aligns with the special attributes of client’s services.
If we dig deeper, we can see that there are also a decent number of users from TX (7.53%) and IL (3.78%). This indicates CA is the potential area for Client to expand their business.
PPC (Pay-per-click)
For PPC insights in this case study, we have only used data from Google Adwords for the period of 2019. Here is an example of the data visualization that we have done to better understand data distribution and data points.
Consistent monitoring of KPIs, experimenting with new tactics and making comparisons are key points for getting insights for PPC decision making.
**Note: The original project consists of dynamic reports using Plotly.
Cost Compositions: Clicks & CPC Daily Trend for All Campaigns’ Data
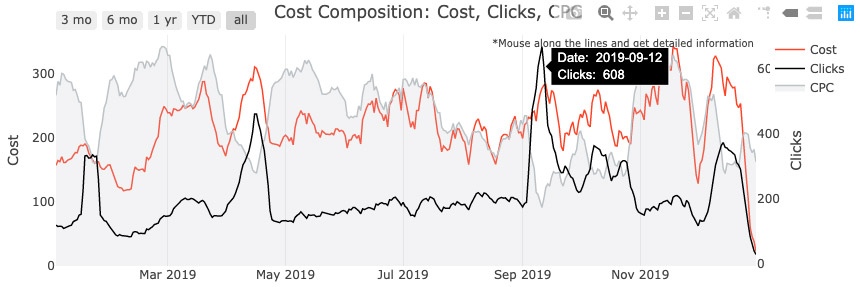
- It’s clear that there is a day-of-the-week effect on these 3 metrics: Cost, Clicks, CPC. To remove this effect, use a 7-day rolling average.
- Next, we want to figure out if there is something that might drive the Clicks. For this purpose, we focus on several campaigns to get insights.
Campaign Clustering by the trend of CPC
We want to cluster campaigns by CPC trending because CPC implicitly tells the performance of PPC.
Here is the Sunburst Charts for Campaigns (w/ Clicks & Cost-share) clustered by CPC trends:
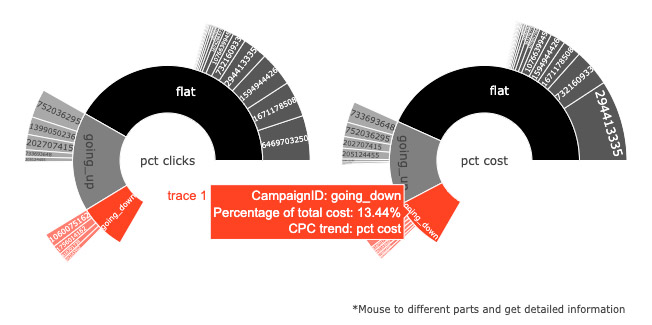
- Most campaigns have a flat or downward trend of CPC, which means that all of these campaigns worked well in this time period
- Next, we pick the highest clicks campaign in each cluster and analyze their performance in-depth.
Top Clicks Campaign & Cost Composition
- The following plots show the basic strategy behind how we made data-driven decisions by tracking key metrics for PPC.
- Notice: Gaps in the following plot mean the campaign was stopped.
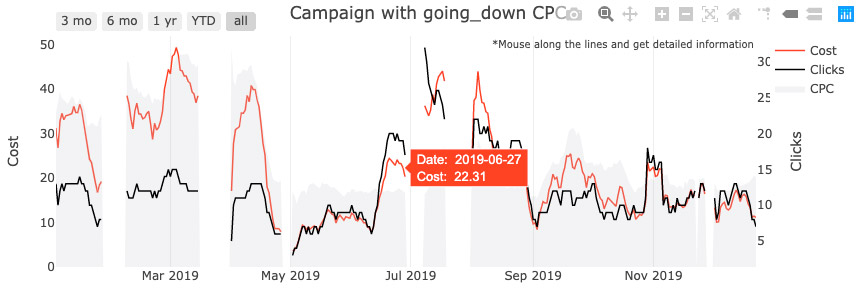
As you can see, after CPC is optimized and tends to flatten. Once the budget increases, the Clicks will increase and keep a stable trend. If CPC increases again, we will take additional actions.
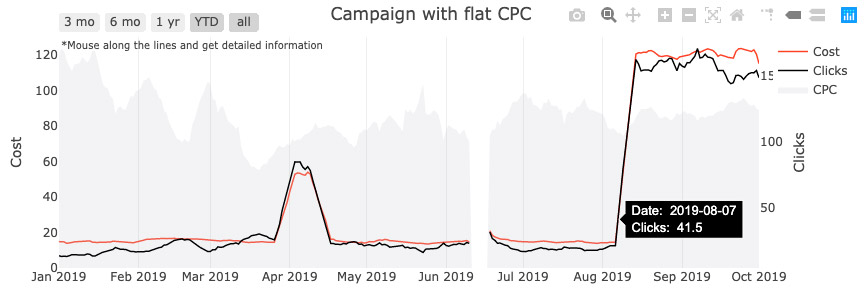
- There are several time periods where Clicks go up suddenly. This might be caused by an increase in budget.
- By keeping the same amount of budget and tracking CPC, we can really get a sense about the performance of our ad campaign optimization (Content team). That’s also why we want to optimize CPC.
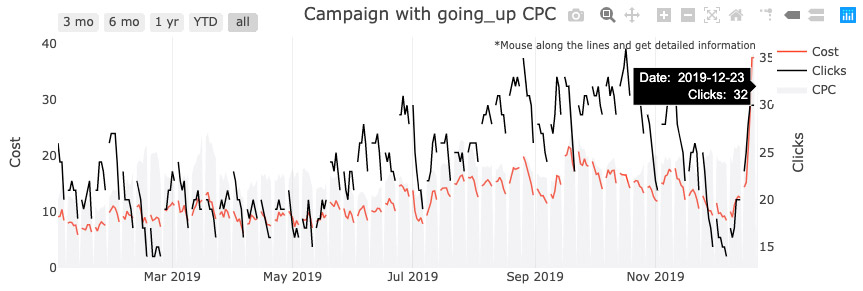
- CPC will always be less than or equal to your maximum bid
- Limit the Max Bid might influence the Clicks, which relates to CPC
- Cost=CPC×Clicks
Campaign Performance Metrics
Clicks & Cost: Treemap
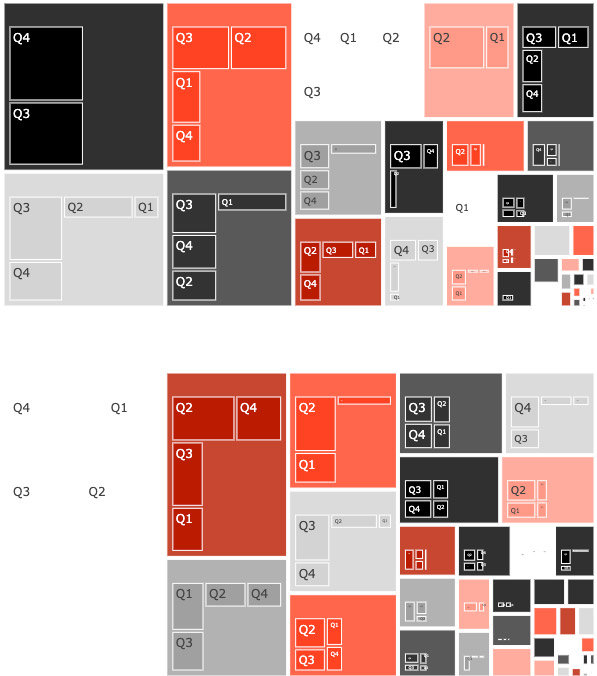
In general, Clicks have been increasing as each quarter goes by.
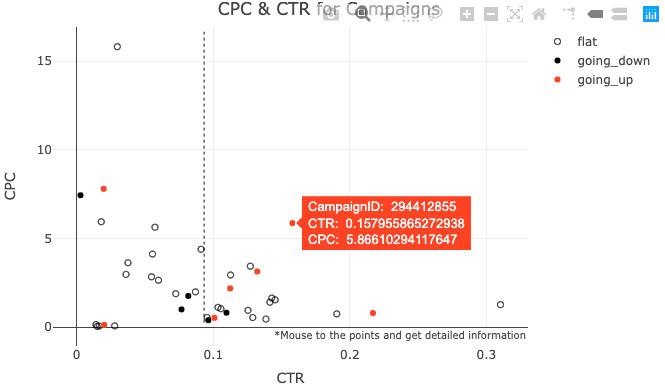
CPC and CTR
In order to compare the campaign performance, we have to look at campaign groups by CPC trends.
“Awesome! Very well done. Turning digital analytics into actionable insights for our business.”

Alex
CEO
 Takes 2 min