How GA & Salesforce Data Led to Actionable Insights

Purpose
Our client is an industry-leading shipping consulting firm that specializes in innovative and intelligent distribution strategies, LTL shippers, and delivers volume parcels. They also offer superior audit services to quickly generate bottom-line savings. Due to their comprehensive marketing practices, they were able to collect well-structured data across different channels. Their goal was to reap the benefits of their hard work to use this data to provide insights into the growth of their revenue. That’s where we came in. We took the initiative to implement in-depth quantitative analysis, machine learning, and data visualization. Using our knowledge and skills we were able to predict at least 29% growth in their month-to-month revenue.
*We will only be sharing a year of data and our stimulation on it for confidential purposes. For data security purposes, the visual plots only display the relative value rather than absolute value.
Dataset
The client, being a visionary, was quick to realize the importance of data. Hence was active to collect data via Google Analytics, Google Adwords, Salesforce and Pardot. The purpose of using these platforms was to gather data about the users visiting their website, their behavior, what kind of content attracts users via ads, details about potential leads and storing information about their sales. Our data science operations on cross channel data sources have given us some valuable insights.
Google Analytics
Google Adwords
Salesforce
Pardot
Insights
The core reason behind this project is to improve conversion rate, to get higher quality leads, and to increase the closing rate by sales.
The main study that we have done revolves around Google Adwords, Google Analytics and Salesforce. Although the conversion rate is key, it’s also very important to use other data aspects such as user quality, features and demographics.
One of the most important KPI is Users.
By tracking the performance of this metric, we get time-series data.

- It’s clear that there is a day-of-the-week effect. To remove this effect, use a 7-day rolling average. Then we can explicitly see the moving trend of Users.
- Anomaly Detection is a commonly used method in time-series analysis. Orange points in this plot are identified as anomaly points by using Anomaly Detection (STL + IQR methods for the situation that seasonality is not a major factor). Grey area covers 95% of all data points. Points out of this area are identified as anomalies.
- For each anomaly point, we will break Users down to several segments to figure out which specific part has caused this positive/negative change. This can help with decision making in the next step. For example, in 2019-12-09, we had 1624 Users which was the maximum. After comparing that with the events tracker that has been placed on pages, we figured out that one of the blogs that we published received an overwhelming response on 2019-12-09, which also shows that Blogs can really be the driving force behind website traffic.
The conversion rate was one of the client’s biggest concerns and the below data visualization makes the case for it.
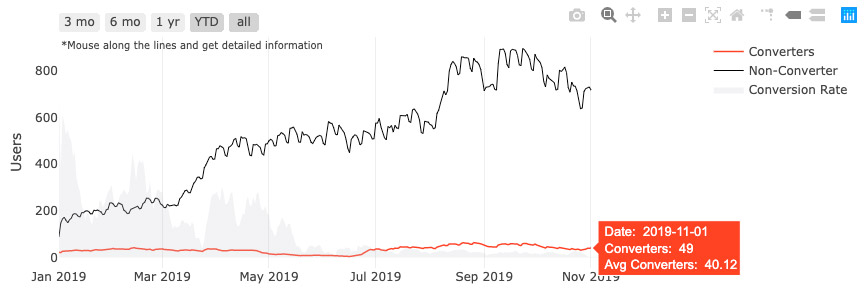
After observing the data from Google Analytics we came to the conclusion that the main traffic source was actually from blogs. The challenge was that these blogs were targeting Users at the awareness phase of the funnel and thus had low conversion rate. Our recommendation was to improve the blog’s internal links and CTAs to boost the conversion rate.
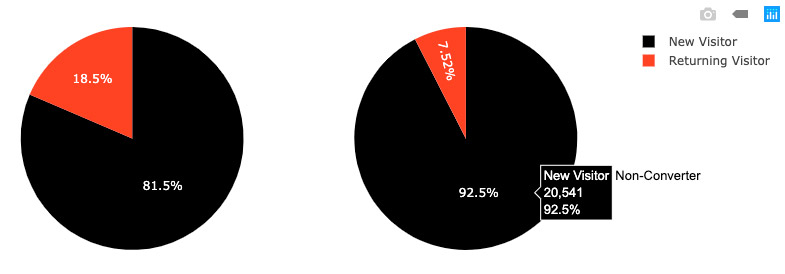
One of the User insights was that the Converters segment shows a higher percentage (18.5%) of Returning Visitors than the Non-Converters segment (17.5%).
Analysis: This implies that the decision to convert span needs multiple sessions. It could also indicate that the e-commerce loyalty program and email marketing efforts were successful in targeting existing users to get them to return to the site. Once we dug deeper, we figured out that it takes multiple sessions to reach a decision point when the session is initiated by an employee with no buying power and is someone who will recommend the product to his/her manager/supervisor. It also tells us that retargeting will be one of the best strategies for this particular business. (This insight refers to Google Analytics Academy. For this pie chart, it only visualized data from 2019-01-01 to 2019-03-31)
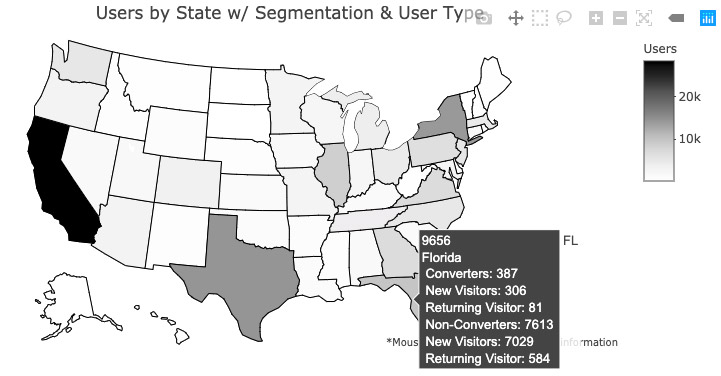
Geographic data
It can also be used to identify the most profitable area of marketing. From the data, it is clear that users mainly came from CA (16.4%) for this time period. This aligns with the special attributes of client’s services.
If we dig deeper, we can see that there are also a decent number of users from TX (8.32%) and NY (7.27%). TX overall achieved a higher Goal Conversion Rate (15.18%) than CA (12.71%). This indicates these are potential areas for Client to expand their business outside CA.
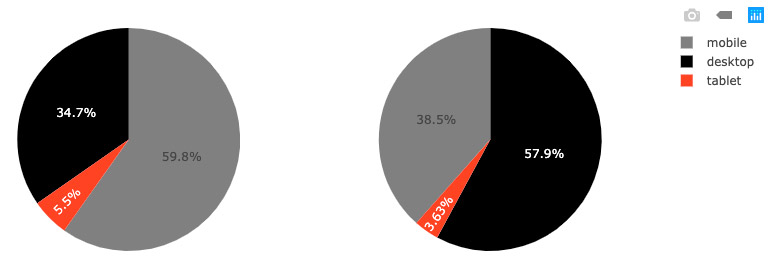
The other and most important insight was in regards to devices and browsers.
Our data visualization made it very clear that, although more Users browse on desktop (55.86%) than mobile (40.35%), Converters mainly used mobile devices (59.8%) rather than desktop (34.7%).
This shows that most of the conversions (for example, submitted a “contact us” form, requested a “30 Days Free Trial”, etc.) are made by mobile devices and that the mobile usability needs to be quick.
As we break down even deeper by operating system, it shows that Converters mainly use IOS mobile (40.5%) and Windows desktop (28.1%).This indicates that most of the purchases are made using mobile devices and that the mobile usability needs to be quick. This could show that Users browse at a rapid speed in Google to find which company is the best fit for them. If a user signs up for a service from a Google ad pop-up and builds a direct relationship with the company, they may not feel the need to visit their website again for purchases. This aligns with above visualization in regards to better conversions by new users. Another thing it indicates is that there is a scope to improve the user experience on the desktop.
We have done further research on users’ data which added more insights to the above section and helped our client use all of this information to come up with a better strategy.
Moving on to the most important dimension where all the hidden answers exist which is PPC.
PPC (Pay-per-click)
For PPC insights in this case study, we have only used data from Google Adwords for the period of 2019. Here is an example of the data visualization that we have done to better understand data distribution and data points.
Consistent monitoring of KPIs, experimenting with new tactics and making comparisons are key points for getting insights for PPC decision making.
**Note: The original project consists of dynamic reports using Plotly.
Cost Compositions: Clicks & CPC Daily Trend for All Campaigns’ Data
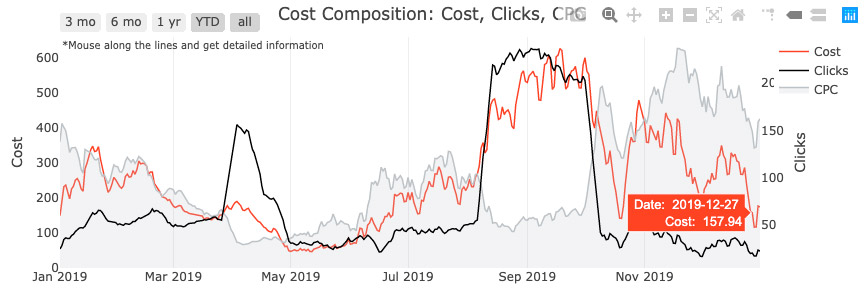
- It’s clear that there is a day-of-the-week effect on these 3 metrics: Cost, Clicks, CPC. To remove this effect, use a 7-day rolling average.
- Next, we want to figure out if there is something that might drive the Clicks. For this purpose, we focus on several campaigns to get insights.
Campaign Clustering by the trend of CPC
We want to cluster campaigns by CPC trending because CPC implicitly tells the performance of PPC.
Here is the Sunburst Charts for Campaigns (w/ Clicks & Cost-share) clustered by CPC trends:
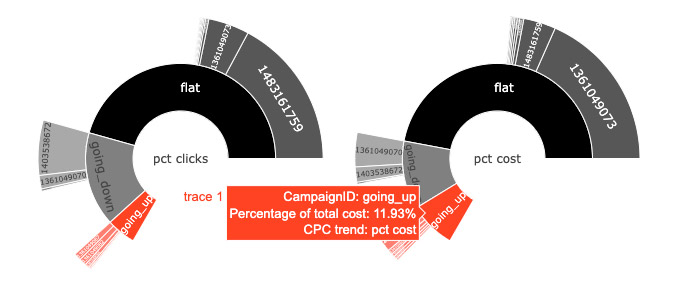
- Most campaigns have a flat or downward trend of CPC, which means that all of these campaigns worked well in this time period
- Next, we pick the highest clicks campaign in each cluster and analyze their performance in-depth.
Top Clicks Campaign & Cost Composition
- The following plots show the basic strategy behind how we made data-driven decisions by tracking key metrics for PPC.
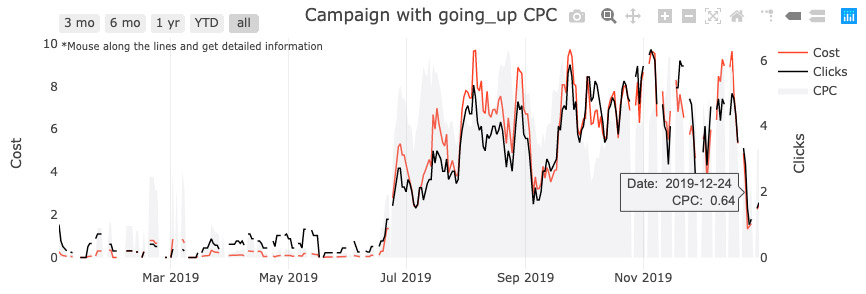
- Notice: Gaps in the following plot mean the campaign was stopped.
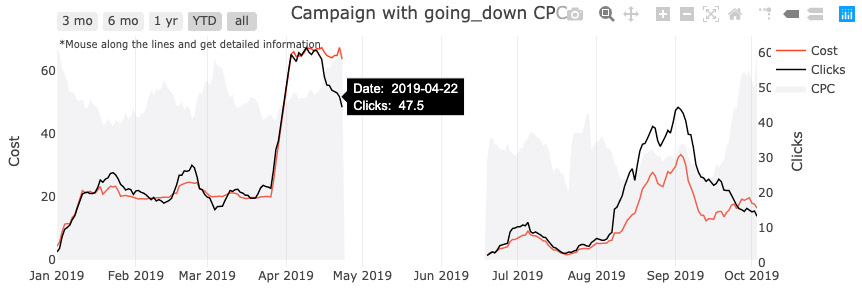
As you can see, after CPC is optimized and tends to flatten. Once the budget increases, the Clicks will increase and keep a stable trend. If CPC increases again, we will take additional actions.
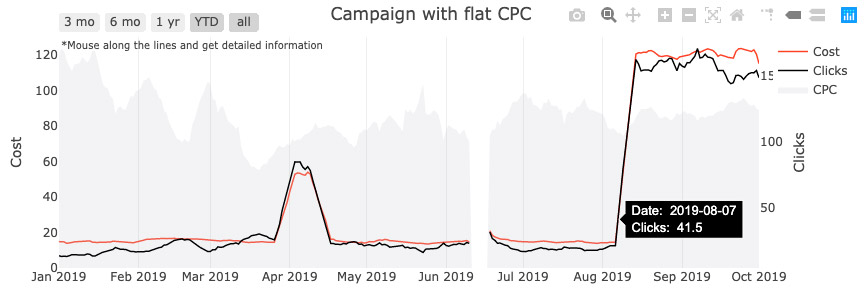
- There are several time periods where Clicks go up suddenly. This might be caused by an increase in budget.
- By keeping the same amount of budget and tracking CPC, we can really get a sense about the performance of our ad campaign optimization (Content team). That’s also why we want to optimize CPC.
- CPC will always be less than or equal to your maximum bid
- Limit the Max Bid might influence the Clicks, which relates to CPC
- Cost=CPC×Clicks
Campaign Performance Metrics
Clicks & Cost: Treemap
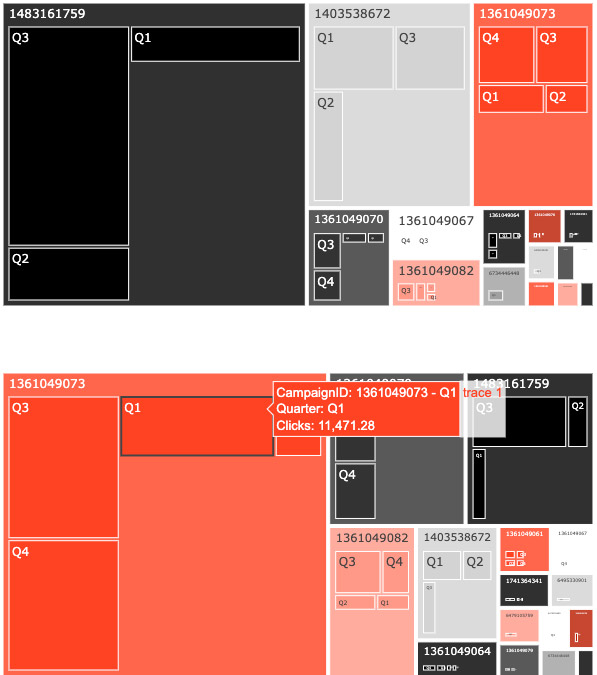
In general, Clicks have been increasing as each quarter goes by.
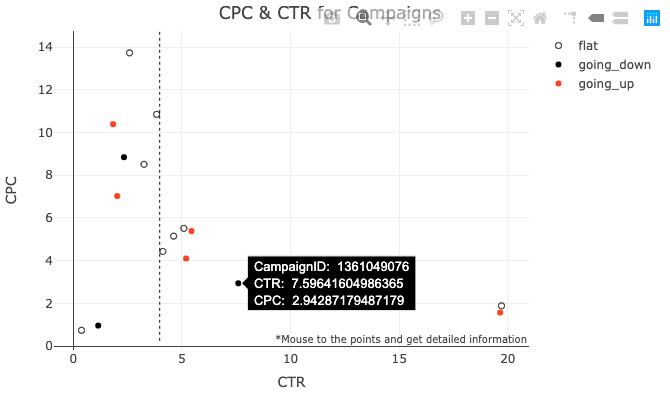
CPC and CTR
In order to compare the campaign performance, we have to look at campaign groups by CPC trends.
“Awesome! Very well done. Turning digital analytics into actionable insights for our business.”

Rob
CEO
 Takes 2 min